
Application of a definite integral to the calculation of the areas of plane figures. Integral

Definition. The difference F (b) – F (a) is called the integral of the function f (x) on the interval [ a ; b ] and is denoted as follows: = F (b) – F (a) – Newton-Leibniz formula.
Geometric meaning of the integral.
The area of a curvilinear trapezoid bounded by a continuous positive graph on the interval [a; b ] functions f (x), the Ox axis and the lines x=a and x= b:
Calculating areas using an integral.
1.The area of a figure limited by a continuous negative graph on the interval [a; b ] functions f (x), the Ox axis and the lines x=a and x= b:
2. The area of the figure limited by the graphs of continuous functions f (x) and the lines x=a, x= b:
3. The area of the figure limited by the graphs of continuous functions f (x) and:
4. The area of the figure limited by the graphs of continuous functions f (x) and the Ox axis:
Problems and tests on the topic "Integral. Calculation of areas using the integral"
- Integral
Lessons: 4 Assignments: 13 Tests: 1
- Calculating areas using integrals - Antiderivative and integral grade 11
Lessons: 1 Assignments: 10 Tests: 1
- Antiderivative - Antiderivative and integral grade 11
Lessons: 1 Assignments: 11 Tests: 1
- Planimetry: calculation of lengths and areas
Tasks: 7
- Calculations and Conversions - Preparation for the Unified State Examination in Mathematics Unified State Examination in Mathematics
Tasks: 10
Before you start calculating the area of a figure bounded by given lines, try to depict this figure in a coordinate system. This will make solving the problem much easier.
Studying theoretical materials on this topic gives you the opportunity to master the concepts of antiderivative and integral, understand the connection between them, master the simplest technique of integral calculus, and learn to apply the integral to calculating the areas of figures limited by graphs of functions.
Examples.
1. Calculate the integral
Solution:
Answer: 0.
2. Find the area of the figure, limited by lines
a) f(x) = 2 X – X 2 and x-axis
Solution: The graph of the function f(x) = 2x - x 2 is a parabola. Vertex: (1; 1).
Answer:(sq. units).
Instructions
When constructing graphs of two given functions, a closed figure is formed in the area of their intersection, bounded by these curves and two straight lines x=a and x=b, where a and b are the ends of the interval under consideration. This figure is visually represented by a stroke. Its area can be calculated by integrating the difference of the functions.
The function located higher on the graph is a larger quantity, therefore, its expression will appear first in the formula: S = ∫f1 – ∫f2, where f1 > f2 on the interval [a, b]. However, taking into account that the quantity of any geometric object is a positive quantity, you can calculate the area of the figure using graphs of functions modulo:
S = |∫f1 – ∫f2|.
This option is all the more convenient if there is no opportunity or time to build a schedule. When calculating, they use the Newton-Leibniz rule, which involves substituting the limit values of the interval into the final result. Then the area of the figure is equal to the difference between two values of the antiderivative found at the integration stage, from the larger F(b) and the smaller F(a).
Sometimes a closed figure on a given interval is formed by complete intersection, i.e. the ends of the interval are points belonging to both curves. For example: find the intersection points of the lines y = x/2 + 5 and y = 3 x – x²/4 + 3 and calculate the area.
Solution.
To find the intersection points, create an equation:
x/2 + 5 = 3 x – x²/4 + 3 → x² – 10 x + 8 = 0
D = 100 - 64 = 36 → x1.2 = (10 ± 6)/2.
So, you have found the ends of the integration interval:
S = |∫ (3 x – x²/4 + 3 – x/2 - 5)dх| = |(5 x²/4 – x³/12 - 2 x)| ≈ 59.
Consider another example: y1 = √(4 x + 5); y2 = x and the equation of the line x = 3 is given.
In this problem, only one end of the interval x=3 is given. This means that the second value must be found from the graph. Construct the lines specified by the functions y1 and y2. Obviously, x=3 is an upper limit, so a lower limit needs to be defined. To do this, equate the expressions:
√(4 x + 5) = x²
4 x + 5 = x² → x² – 4 x – 5 = 0
Find the roots of the equation:
D = 16 + 20 = 36 → x1 = 5; x2 = -1.
Look at the graph, the lower value of the interval is -1. Since y1 is located above y2, then:
S = ∫(√(4 x + 5) - x)dx on the interval [-1; 3].
S = (1/3 √((4 x + 5)³) – x²/2) = 19.
Sources:
- find the area of a figure bounded by the graph of the function
Tip 2: How to calculate the area of a figure bounded by lines
Instructions
Calculate the intersection points of these lines. To do this, you need their functions, where y will be expressed through x1 and x2. Create a system of equations and solve it. The x1 and x2 you found are the abscissas of the points you need. Substitute them into the original ones for each x and find the ordinate values. Now you have the points where the lines intersect.
Draw intersecting lines according to their functions. If the figure turns out to be open, then in most cases it is also limited by the abscissa or ordinate axis, or by both coordinate axes at once (depending on the resulting figure).
Shade the resulting figure. This is a standard design technique this kind tasks. Hatching is done from the upper left corner to the lower right corner with lines located at equal distances. This looks extremely difficult at first glance, but if you think about it, they are always the same and, by remembering them, you can later get rid of the problems associated with calculating the area.
Calculate the area of a figure depending on its . If the shape is simple (such as a square, triangle, rhombus and others), then use the basic formulas from the geometry course. Be careful when calculating, as incorrect calculations will not give the desired result, and all the work may be in vain.
Perform complex calculations using a formula if the figure is not a standard one. To compose the formula, calculate the integral from the difference of the function formulas. To find the integral, you can use the Newton-Leibniz formula or the fundamental theorem of analysis. It is as follows: if the function f is continuous on the interval from a to b and ɸ is its derivative on this interval, then the following equality is valid: the integral from a to b of f(x)dx = F(b) - F(a) .
The geometric meaning of a definite integral is the area of a curvilinear trapezoid. To find the area of a figure bounded by lines, one of the properties of the integral is used, which is the additivity of areas integrated on the same segment of functions.

Instructions
Then the area of the figure can be expressed by a formula that integrates the difference of functions on the interval. The integral is calculated according to the Newton-Leibniz law, according to which the result is equal to the difference of the antiderivative function from the boundary values of the interval.
Example 1.
Find the area of the figure bounded by straight lines y = -1/3 x – ½, x = 1, x = 4 and a parabola y = -x² + 6 x – 5.
Solution.
Plot graphs of all lines. You can see that the parabola line is above the straight line y = -1/3 x – ½. Therefore, under the integral sign in in this case there must be a difference between the equation of the parabola and the given straight line. The integration interval, accordingly, is between points x = 1 and x = 4:
S = ∫(-x² + 6 x – 5 – (-1/3 x – 1/2))dx = (-x² +19/3 x – 9/2)dx on the segment .
Find the antiderivative for the resulting integrand:
F(-x² + 19/3x – 9/2) = -1/3x³ + 19/6x² – 9/2x.
Substitute the values of the ends of the segment:
S = (-1/3·4³ + 19/6·4² – 9/2·4) – (-1/3·1³ + 19/6·1² – 9/2·1) = 13.
Example 2.
Calculate the area of the figure bounded by the lines y = √(x + 2), y = x and the line x = 7.
Solution.
This problem is more difficult than the previous one, since there is no second straight line parallel to the x-axis. This means that the second boundary value of the integral is indefinite. Therefore, it must be found from the graph. Draw the given lines.
You will see that the straight line y = x runs diagonally with respect to the coordinate axes. And the graph of the root function is the positive half of the parabola. Obviously, the lines on the graph intersect, so the intersection point will be the lower limit of integration.
Find the intersection point by solving the equation:
x = √(x + 2) → x² = x + 2 → x² – x – 2 = 0.
Identify the roots quadratic equation using a discriminant:
D = 9 → x1 = 2; x2 = -1.
Obviously, the value -1 is not suitable, since the abscissa of the crossing currents is a positive value. Therefore, the second limit of integration is x = 2. The function y = x on the graph is above the function y = √(x + 2), so it will be first in the integral.
Integrate the resulting expression over the interval and find the area of the figure:
S = ∫(x - √(x + 2))dx = (x²/2 – 2/3·(x + 2)^(3/2)).
Substitute interval values:
S = (7²/2 – 2/3 9^(3/2)) – (2²/2 – 2/3 4^(3/2)) = 59/6.
Sources:
- find the area enclosed by the lines
Tip 4: How to calculate the area of a figure bounded by a parabola
It is also known from the school course that to find the areas of figures on the coordinate plane, you need to know such a concept as an integral. To use it to determine the areas of curvilinear trapezoids - this is what these figures are called - it is enough to know certain algorithms.
In the previous section on parsing geometric meaning definite integral, we received a number of formulas for calculating the area of a curvilinear trapezoid:
Yandex.RTB R-A-339285-1
S (G) = ∫ a b f (x) d x for a continuous and non-negative function y = f (x) on the interval [ a ; b ] ,
S (G) = - ∫ a b f (x) d x for a continuous and non-positive function y = f (x) on the interval [ a ; b ] .
These formulas are applicable to solving relatively simple problems. In reality, we will often have to work with more complex figures. In this regard, we will devote this section to an analysis of algorithms for calculating the area of figures that are limited by functions in explicit form, i.e. like y = f(x) or x = g(y).
TheoremLet the functions y = f 1 (x) and y = f 2 (x) be defined and continuous on the interval [ a ; b ] , and f 1 (x) ≤ f 2 (x) for any value x from [ a ; b ] . Then the formula for calculating the area of the figure G, bounded by the lines x = a, x = b, y = f 1 (x) and y = f 2 (x) will look like S (G) = ∫ a b f 2 (x) - f 1 (x) d x .
A similar formula will be applicable for the area of a figure bounded by the lines y = c, y = d, x = g 1 (y) and x = g 2 (y): S (G) = ∫ c d (g 2 (y) - g 1 (y) d y .
Proof
Let's look at three cases for which the formula will be valid.
In the first case, taking into account the property of additivity of area, the sum of the areas of the original figure G and the curvilinear trapezoid G 1 is equal to the area of the figure G 2. It means that
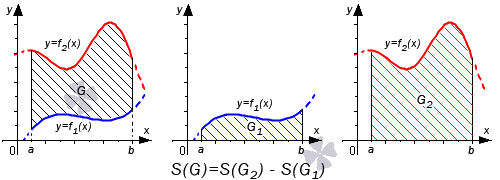
Therefore, S (G) = S (G 2) - S (G 1) = ∫ a b f 2 (x) d x - ∫ a b f 1 (x) d x = ∫ a b (f 2 (x) - f 1 (x)) dx.
We can perform the last transition using the third property of the definite integral.
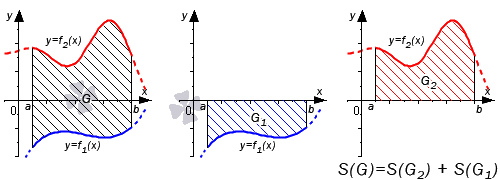
In the second case, the equality is true: S (G) = S (G 2) + S (G 1) = ∫ a b f 2 (x) d x + - ∫ a b f 1 (x) d x = ∫ a b (f 2 (x) - f 1 (x)) d x
The graphic illustration will look like:
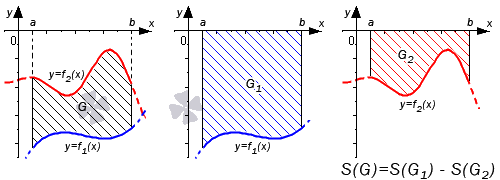
If both functions are non-positive, we get: S (G) = S (G 2) - S (G 1) = - ∫ a b f 2 (x) d x - - ∫ a b f 1 (x) d x = ∫ a b (f 2 (x) - f 1 (x)) d x . The graphic illustration will look like:
Let's move on to consider the general case when y = f 1 (x) and y = f 2 (x) intersect the O x axis.
We denote the intersection points as x i, i = 1, 2, . . . , n - 1 . These points split the segment [a; b ] into n parts x i - 1 ; x i, i = 1, 2, . . . , n, where α = x 0< x 1 < x 2 < . . . < x n - 1 < x n = b . Фигуру G можно представить объединением фигур G i , i = 1 , 2 , . . . , n . Очевидно, что на своем интервале G i попадает под один из трех рассмотренных ранее случаев, поэтому их площади находятся как S (G i) = ∫ x i - 1 x i (f 2 (x) - f 1 (x)) d x , i = 1 , 2 , . . . , n
Hence,
S (G) = ∑ i = 1 n S (G i) = ∑ i = 1 n ∫ x i x i f 2 (x) - f 1 (x)) d x = = ∫ x 0 x n (f 2 (x) - f ( x)) d x = ∫ a b f 2 (x) - f 1 (x) d x
We can make the last transition using the fifth property of the definite integral.
Let us illustrate the general case on the graph.

The formula S (G) = ∫ a b f 2 (x) - f 1 (x) d x can be considered proven.
Now let's move on to analyzing examples of calculating the area of figures that are limited by the lines y = f (x) and x = g (y).
We will begin our consideration of any of the examples by constructing a graph. The image will allow us to represent complex shapes as unions of simpler shapes. If constructing graphs and figures on them is difficult for you, you can study the section on basic elementary functions, geometric transformation of graphs of functions, as well as constructing graphs while studying a function.
Example 1
It is necessary to determine the area of the figure, which is limited by the parabola y = - x 2 + 6 x - 5 and straight lines y = - 1 3 x - 1 2, x = 1, x = 4.
Solution
Let's draw the lines on the graph in the Cartesian coordinate system.

On the segment [ 1 ; 4 ] the graph of the parabola y = - x 2 + 6 x - 5 is located above the straight line y = - 1 3 x - 1 2. In this regard, to obtain the answer we use the formula obtained earlier, as well as the method of calculating the definite integral using the Newton-Leibniz formula:
S (G) = ∫ 1 4 - x 2 + 6 x - 5 - - 1 3 x - 1 2 d x = = ∫ 1 4 - x 2 + 19 3 x - 9 2 d x = - 1 3 x 3 + 19 6 x 2 - 9 2 x 1 4 = = - 1 3 4 3 + 19 6 4 2 - 9 2 4 - - 1 3 1 3 + 19 6 1 2 - 9 2 1 = = - 64 3 + 152 3 - 18 + 1 3 - 19 6 + 9 2 = 13
Answer: S(G) = 13
Let's look at a more complex example.
Example 2
It is necessary to calculate the area of the figure, which is limited by the lines y = x + 2, y = x, x = 7.
Solution
In this case, we have only one straight line located parallel to the x-axis. This is x = 7. This requires us to find the second limit of integration ourselves.
Let's build a graph and plot on it the lines given in the problem statement.

Having the graph in front of our eyes, we can easily determine that the lower limit of integration will be the abscissa of the point of intersection of the graph of the straight line y = x and the semi-parabola y = x + 2. To find the abscissa we use the equalities:
y = x + 2 O DZ: x ≥ - 2 x 2 = x + 2 2 x 2 - x - 2 = 0 D = (- 1) 2 - 4 1 (- 2) = 9 x 1 = 1 + 9 2 = 2 ∈ O DZ x 2 = 1 - 9 2 = - 1 ∉ O DZ
It turns out that the abscissa of the intersection point is x = 2.
We draw your attention to the fact that in general example in the drawing, the lines y = x + 2, y = x intersect at the point (2; 2), so such detailed calculations may seem unnecessary. We have provided such a detailed solution here only because in more complex cases the solution may not be so obvious. This means that it is always better to calculate the coordinates of the intersection of lines analytically.
On the interval [ 2 ; 7] the graph of the function y = x is located above the graph of the function y = x + 2. Let's apply the formula to calculate the area:
S (G) = ∫ 2 7 (x - x + 2) d x = x 2 2 - 2 3 · (x + 2) 3 2 2 7 = = 7 2 2 - 2 3 · (7 + 2) 3 2 - 2 2 2 - 2 3 2 + 2 3 2 = = 49 2 - 18 - 2 + 16 3 = 59 6
Answer: S (G) = 59 6
Example 3
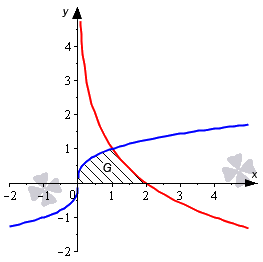
It is necessary to calculate the area of the figure, which is limited by the graphs of the functions y = 1 x and y = - x 2 + 4 x - 2.
Solution
Let's plot the lines on the graph.
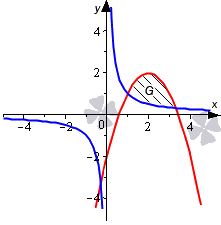
Let's define the limits of integration. To do this, we determine the coordinates of the points of intersection of the lines by equating the expressions 1 x and - x 2 + 4 x - 2. Provided that x is not zero, the equality 1 x = - x 2 + 4 x - 2 becomes equivalent to the third degree equation - x 3 + 4 x 2 - 2 x - 1 = 0 with integer coefficients. To refresh your memory of the algorithm for solving such equations, we can refer to the section “Solving cubic equations.”
The root of this equation is x = 1: - 1 3 + 4 1 2 - 2 1 - 1 = 0.
Dividing the expression - x 3 + 4 x 2 - 2 x - 1 by the binomial x - 1, we get: - x 3 + 4 x 2 - 2 x - 1 ⇔ - (x - 1) (x 2 - 3 x - 1) = 0
We can find the remaining roots from the equation x 2 - 3 x - 1 = 0:
x 2 - 3 x - 1 = 0 D = (- 3) 2 - 4 · 1 · (- 1) = 13 x 1 = 3 + 13 2 ≈ 3 . 3; x 2 = 3 - 13 2 ≈ - 0 . 3
We found the interval x ∈ 1; 3 + 13 2, in which the figure G is contained above the blue and below the red line. This helps us determine the area of the figure:
S (G) = ∫ 1 3 + 13 2 - x 2 + 4 x - 2 - 1 x d x = - x 3 3 + 2 x 2 - 2 x - ln x 1 3 + 13 2 = = - 3 + 13 2 3 3 + 2 3 + 13 2 2 - 2 3 + 13 2 - ln 3 + 13 2 - - - 1 3 3 + 2 1 2 - 2 1 - ln 1 = 7 + 13 3 - ln 3 + 13 2
Answer: S (G) = 7 + 13 3 - ln 3 + 13 2
Example 4
It is necessary to calculate the area of the figure, which is limited by the curves y = x 3, y = - log 2 x + 1 and the abscissa axis.
Solution
Let's plot all the lines on the graph. We can get the graph of the function y = - log 2 x + 1 from the graph y = log 2 x if we position it symmetrically about the x-axis and move it up one unit. The equation of the x-axis is y = 0.
Let us mark the points of intersection of the lines.
As can be seen from the figure, the graphs of the functions y = x 3 and y = 0 intersect at the point (0; 0). This happens because x = 0 is the only real root of the equation x 3 = 0.
x = 2 is the only root of the equation - log 2 x + 1 = 0, so the graphs of the functions y = - log 2 x + 1 and y = 0 intersect at the point (2; 0).
x = 1 is the only root of the equation x 3 = - log 2 x + 1 . In this regard, the graphs of the functions y = x 3 and y = - log 2 x + 1 intersect at the point (1; 1). The last statement may not be obvious, but the equation x 3 = - log 2 x + 1 cannot have more than one root, since the function y = x 3 is strictly increasing, and the function y = - log 2 x + 1 is strictly decreasing.
The further solution involves several options.
Option #1
We can imagine the figure G as the sum of two curvilinear trapezoids located above the x-axis, the first of which is located below the midline on the segment x ∈ 0; 1, and the second is below the red line on the segment x ∈ 1; 2. This means that the area will be equal to S (G) = ∫ 0 1 x 3 d x + ∫ 1 2 (- log 2 x + 1) d x .
Option No. 2
Figure G can be represented as the difference of two figures, the first of which is located above the x-axis and below the blue line on the segment x ∈ 0; 2, and the second between the red and blue lines on the segment x ∈ 1; 2. This allows us to find the area as follows:
S (G) = ∫ 0 2 x 3 d x - ∫ 1 2 x 3 - (- log 2 x + 1) d x
In this case, to find the area you will have to use a formula of the form S (G) = ∫ c d (g 2 (y) - g 1 (y)) d y. In fact, the lines that bound the figure can be represented as functions of the argument y.
Let's solve the equations y = x 3 and - log 2 x + 1 with respect to x:
y = x 3 ⇒ x = y 3 y = - log 2 x + 1 ⇒ log 2 x = 1 - y ⇒ x = 2 1 - y
We get the required area:
S (G) = ∫ 0 1 (2 1 - y - y 3) d y = - 2 1 - y ln 2 - y 4 4 0 1 = = - 2 1 - 1 ln 2 - 1 4 4 - - 2 1 - 0 ln 2 - 0 4 4 = - 1 ln 2 - 1 4 + 2 ln 2 = 1 ln 2 - 1 4
Answer: S (G) = 1 ln 2 - 1 4
Example 5
It is necessary to calculate the area of the figure, which is limited by the lines y = x, y = 2 3 x - 3, y = - 1 2 x + 4.
Solution
We will draw a line on the graph with a red line, given by the function y = x. We draw the line y = - 1 2 x + 4 in blue, and the line y = 2 3 x - 3 in black.

Let's mark the intersection points.
Let's find the intersection points of the graphs of the functions y = x and y = - 1 2 x + 4:
x = - 1 2 x + 4 O DZ: x ≥ 0 x = - 1 2 x + 4 2 ⇒ x = 1 4 x 2 - 4 x + 16 ⇔ x 2 - 20 x + 64 = 0 D = (- 20) 2 - 4 1 64 = 144 x 1 = 20 + 144 2 = 16 ; x 2 = 20 - 144 2 = 4 Check: x 1 = 16 = 4, - 1 2 x 1 + 4 = - 1 2 16 + 4 = - 4 ⇒ x 1 = 16 not Is the solution to the equation x 2 = 4 = 2, - 1 2 x 2 + 4 = - 1 2 4 + 4 = 2 ⇒ x 2 = 4 is the solution to the equation ⇒ (4; 2) point of intersection i y = x and y = - 1 2 x + 4
Let's find the intersection point of the graphs of the functions y = x and y = 2 3 x - 3:
x = 2 3 x - 3 O DZ: x ≥ 0 x = 2 3 x - 3 2 ⇔ x = 4 9 x 2 - 4 x + 9 ⇔ 4 x 2 - 45 x + 81 = 0 D = (- 45 ) 2 - 4 4 81 = 729 x 1 = 45 + 729 8 = 9, x 2 45 - 729 8 = 9 4 Check: x 1 = 9 = 3, 2 3 x 1 - 3 = 2 3 9 - 3 = 3 ⇒ x 1 = 9 is the solution to the equation ⇒ (9 ; 3) point a s y = x and y = 2 3 x - 3 x 2 = 9 4 = 3 2, 2 3 x 1 - 3 = 2 3 9 4 - 3 = - 3 2 ⇒ x 2 = 9 4 There is no solution to the equation
Let's find the point of intersection of the lines y = - 1 2 x + 4 and y = 2 3 x - 3:
1 2 x + 4 = 2 3 x - 3 ⇔ - 3 x + 24 = 4 x - 18 ⇔ 7 x = 42 ⇔ x = 6 - 1 2 6 + 4 = 2 3 6 - 3 = 1 ⇒ (6 ; 1) point of intersection y = - 1 2 x + 4 and y = 2 3 x - 3
Method No. 1
Let us imagine the area of the desired figure as the sum of the areas of individual figures.

Then the area of the figure is:
S (G) = ∫ 4 6 x - - 1 2 x + 4 d x + ∫ 6 9 x - 2 3 x - 3 d x = = 2 3 x 3 2 + x 2 4 - 4 x 4 6 + 2 3 x 3 2 - x 2 3 + 3 x 6 9 = = 2 3 6 3 2 + 6 2 4 - 4 6 - 2 3 4 3 2 + 4 2 4 - 4 4 + + 2 3 9 3 2 - 9 2 3 + 3 9 - 2 3 6 3 2 - 6 2 3 + 3 6 = = - 25 3 + 4 6 + - 4 6 + 12 = 11 3
Method No. 2
The area of the original figure can be represented as the sum of two other figures.

Then we solve the equation of the line relative to x, and only after that we apply the formula for calculating the area of the figure.
y = x ⇒ x = y 2 red line y = 2 3 x - 3 ⇒ x = 3 2 y + 9 2 black line y = - 1 2 x + 4 ⇒ x = - 2 y + 8 s i n i a l i n e
So the area is:
S (G) = ∫ 1 2 3 2 y + 9 2 - - 2 y + 8 d y + ∫ 2 3 3 2 y + 9 2 - y 2 d y = = ∫ 1 2 7 2 y - 7 2 d y + ∫ 2 3 3 2 y + 9 2 - y 2 d y = = 7 4 y 2 - 7 4 y 1 2 + - y 3 3 + 3 y 2 4 + 9 2 y 2 3 = 7 4 2 2 - 7 4 2 - 7 4 1 2 - 7 4 1 + + - 3 3 3 + 3 3 2 4 + 9 2 3 - - 2 3 3 + 3 2 2 4 + 9 2 2 = = 7 4 + 23 12 = 11 3
As you can see, the values are the same.
Answer: S (G) = 11 3
Results
To find the area of a figure that is limited by given lines, we need to construct lines on a plane, find their intersection points, and apply the formula to find the area. IN this section We looked at the most common variants of problems.
If you notice an error in the text, please highlight it and press Ctrl+Enter
We begin to consider the actual process of calculating the double integral and get acquainted with its geometric meaning.
Double integral numerically equal to area flat figure (region of integration). This simplest form double integral, when the function of two variables is equal to one: .
Let's first consider the problem in general view. Now you will be quite surprised how simple everything really is! Let's calculate the area of a flat figure bounded by lines. For definiteness, we assume that on the segment . The area of this figure is numerically equal to:
Let's depict the area in the drawing: 
Let's choose the first way to traverse the area: ![]()
Thus: 
And immediately an important technical technique: iterated integrals can be calculated separately. First the inner integral, then the outer integral. I highly recommend this method to beginners in the subject.
1) Let's calculate the internal integral, and the integration is carried out over the variable “y”: 
The indefinite integral here is the simplest, and then the banal Newton-Leibniz formula is used, with the only difference that the limits of integration are not numbers, but functions. First they put it in “Y” ( antiderivative function) upper limit, then lower limit
2) The result obtained in the first paragraph must be substituted into the external integral: 
A more compact representation of the entire solution looks like this:
The resulting formula  - that's exactly working formula to calculate the area of a plane figure using the “ordinary” definite integral! Watch the lesson Calculating area using a definite integral, there she is at every step!
That is, problem of calculating area using double integral not much different from the problem of finding the area using a definite integral! In fact, it's the same thing!
Accordingly, no difficulties should arise! I won’t look at very many examples, since you, in fact, have repeatedly encountered this task.
Example 9
Solution: Let's depict the area in the drawing: 
Let us choose the following order of traversal of the area: ![]()
Here and further I will not dwell on how to traverse the area, since very detailed explanations were given in the first paragraph.
Thus: 
As I already noted, it is better for beginners to calculate iterated integrals separately, and I will stick to the same method:
1) First, using the Newton-Leibniz formula, we deal with the internal integral: 
2) The result obtained in the first step is substituted into the external integral: 
Point 2 is actually finding the area of a plane figure using a definite integral.
Answer:
This is such a stupid and naive task.
An interesting example for independent decision:
Example 10
Using a double integral, calculate the area of a plane figure bounded by the lines , ,
An approximate example of a final solution at the end of the lesson.
In Examples 9-10, it is much more profitable to use the first method of traversing the area; curious readers, by the way, can change the order of traversal and calculate the areas using the second method. If you do not make a mistake, then, naturally, you will get the same area values.
But in some cases, the second method of traversing the area is more effective, and at the end of the young nerd’s course, let’s look at a couple more examples on this topic:
Example 11
Using a double integral, calculate the area of a plane figure bounded by lines,
Solution: We are looking forward to two parabolas with a quirk that lie on their sides. There is no need to smile; similar things occur quite often in multiple integrals.
What is the easiest way to make a drawing?
Let's imagine a parabola in the form of two functions:
– the upper branch and – the lower branch.
Similarly, imagine a parabola in the form of upper and lower ![]() branches.
branches.
Next, point-wise plotting of graphs rules, resulting in such a bizarre figure: 
We calculate the area of the figure using the double integral according to the formula:
What happens if we choose the first method of traversing the area? Firstly, this area will have to be divided into two parts. And secondly, we will observe this sad picture:  . Integrals, of course, are not of a super-complicated level, but... there is an old mathematical saying: those who are close to their roots do not need a test.
Therefore, from the misunderstanding given in the condition, we express the inverse functions: 
Inverse functions in in this example have the advantage that they specify the entire parabola at once without any leaves, acorns, branches and roots.
According to the second method, the area traversal will be as follows: 
Thus: 
As they say, feel the difference.
1) We deal with the internal integral:
We substitute the result into the outer integral:
Integration over the variable “y” should not be confusing; if there were a letter “zy”, it would be great to integrate over it. Although who read the second paragraph of the lesson How to calculate the volume of a body of rotation, he no longer experiences the slightest awkwardness with integration according to the “Y” method.
Also pay attention to the first step: the integrand is even, and the interval of integration is symmetrical about zero. Therefore, the segment can be halved, and the result can be doubled. This technique is commented in detail in the lesson. Effective methods calculation of a definite integral.
What to add…. All!
Answer:
To test your integration technique, you can try to calculate . The answer should be exactly the same.
Example 12
Using a double integral, calculate the area of a plane figure bounded by lines ![]()
This is an example for you to solve on your own. It is interesting to note that if you try to use the first method of traversing the area, the figure will no longer have to be divided into two, but into three parts! And, accordingly, we get three pairs of repeated integrals. Sometimes it happens.
The master class has come to an end, and it’s time to move on to the grandmaster level - How to calculate double integral? Examples of solutions. I’ll try not to be so maniacal in the second article =)
I wish you success!
Solutions and answers:
Example 2:Solution:
Let's depict the area on the drawing:
Let us choose the following order of traversal of the area:
Thus: 
Let's move on to inverse functions:
Thus: 
Answer:
Example 4:Solution:
Let's move on to direct functions:
Let's make the drawing:

Let's change the order of traversing the area:
![]()
Answer:

In fact, in order to find the area of a figure, you don’t need that much knowledge of the indefinite and definite integral. The task “calculate the area using a definite integral” always involves constructing a drawing, so much more topical issue will be your knowledge and skills in drawing. In this regard, it is useful to refresh your memory of the graphs of the main elementary functions, and, at a minimum, be able to construct a straight line and a hyperbola.
A curved trapezoid is a flat figure bounded by an axis, straight lines, and the graph of a function continuous on a segment that does not change sign on this interval. Let this figure be located not less x-axis:

Then the area of a curvilinear trapezoid is numerically equal to a definite integral. Any definite integral (that exists) has a very good geometric meaning.
From the point of view of geometry, the definite integral is AREA.
That is, a certain integral (if it exists) geometrically corresponds to the area of a certain figure. For example, consider the definite integral. The integrand defines a curve on the plane located above the axis (those who wish can make a drawing), and the definite integral itself is numerically equal to the area of the corresponding curvilinear trapezoid.
Example 1
This is a typical assignment statement. The first and most important point of the decision is the construction of the drawing. Moreover, the drawing must be constructed RIGHT.
When constructing a drawing, I recommend the following order: at first it is better to construct all straight lines (if they exist) and only Then- parabolas, hyperbolas, graphs of other functions. It is more profitable to build graphs of functions point by point.
In this problem, the solution might look like this.
Let's draw the drawing (note that the equation defines the axis):

On the segment, the graph of the function is located above the axis, That's why:
Answer:
After the task is completed, it is always useful to look at the drawing and figure out whether the answer is real. In this case, “by eye” we count the number of cells in the drawing - well, there will be about 9, it seems to be true. It is absolutely clear that if we got, say, the answer: 20 square units, then it is obvious that a mistake was made somewhere - 20 cells obviously do not fit into the figure in question, at most a dozen. If the answer is negative, then the task was also solved incorrectly.
Example 3
Calculate the area of the figure bounded by lines and coordinate axes.
Solution: Let's make a drawing:

If a curved trapezoid is located under the axle(or at least not higher given axis), then its area can be found using the formula:
In this case:

Attention! The two types of tasks should not be confused:
1) If you are asked to solve simply a definite integral without any geometric meaning, then it may be negative.
2) If you are asked to find the area of a figure using a definite integral, then the area is always positive! That is why the minus appears in the formula just discussed.
In practice, most often the figure is located in both the upper and lower half-plane, and therefore, from the simplest school problems we move on to more meaningful examples.
Example 4
Find the area of a plane figure bounded by the lines , .
Solution: First you need to complete the drawing. Generally speaking, when constructing a drawing in area problems, we are most interested in the points of intersection of lines. Let's find the intersection points of the parabola and the straight line. This can be done in two ways. The first method is analytical. We solve the equation:
This means that the lower limit of integration is , the upper limit of integration is .
If possible, it is better not to use this method..
It is much more profitable and faster to construct lines point by point, and the limits of integration become clear “by themselves.” Nevertheless, the analytical method of finding limits still sometimes has to be used if, for example, the graph is large enough, or the detailed construction did not reveal the limits of integration (they can be fractional or irrational). And we will also consider such an example.
Let's return to our task: it is more rational to first construct a straight line and only then a parabola. Let's make the drawing:

And now the working formula: If there is some continuous function on the segment greater than or equal to some continuous function, then the area of the figure limited by the graphs of these functions and the lines , , can be found using the formula: 
Here you no longer need to think about where the figure is located - above the axis or below the axis, and, roughly speaking, it matters which graph is HIGHER(relative to another graph), and which one is BELOW.
In the example under consideration, it is obvious that on the segment the parabola is located above the straight line, and therefore it is necessary to subtract from
The completed solution might look like this:
The desired figure is limited by a parabola above and a straight line below.
On the segment, according to the corresponding formula:
Answer:
Example 4
Calculate the area of the figure bounded by the lines , , , .
Solution: First, let's make a drawing:

The figure whose area we need to find is shaded blue(look carefully at the condition - how the figure is limited!). But in practice, due to inattention, a “glitch” often occurs that you need to find the area of a figure that is shaded in green!
This example is also useful in that it calculates the area of a figure using two definite integrals.
Really:
1) On the segment above the axis there is a graph of a straight line;
2) On the segment above the axis there is a graph of a hyperbola.
It is quite obvious that the areas can (and should) be added, therefore:

Publications on the topic
-
 How to choose the “right” soy sauce?
Until relatively recently, the only available seasonings for dishes were salt and pepper. Today the abundance of options is simply amazing. And that's it...
-
 Pies with cottage cheese made from yeast dough Delicious pies with cottage cheese in the oven
If you are a big fan of homemade baking, then you will like this recipe for cottage cheese pies. Rich, tender, sweet, with a slight...